Mapping software has profoundly transformed the way we analyze, visualize, and understand territory. Far from being reserved for geographers or urban planners, these tools are now at the heart of many professions: marketing, real estate, transportation, ecology, land use planning, and network management. Thanks to the power of geographic data and the democratization of intuitive interfaces, mapping has become an essential decision-making aid.
Sommaire
What is mapping software?
A mapping software is a computer application that allows the creation, consultation, and analysis of interactive digital maps. These maps are no longer limited to representing roads or terrain: they now integrate complex data — socio-economic, commercial, environmental, or demographic — to produce a dynamic vision of the territory.
There are several categories of software:
- Generalist mapping tools such as QGIS or ArcGIS, intended for geomatics specialists and administrations.
- Thematic mapping software, used to represent specific data (population density, pollution, mobility, etc.).
- Industry platforms, such as those used in real estate or retail, which allow cross-referencing geographic data with economic or commercial indicators.
These tools rely on common principles: geolocation of data, their spatial visualization, and the modeling of territorial indicators.
Why mapping software has become indispensable
The main asset of mapping software lies in its ability to make the complexity of reality visual and understandable. Where a table of numbers or an Excel file remains abstract, the map allows immediate comprehension of spatial phenomena. It addresses several challenges:
- Territorial decision-making: choosing the optimal location for a new store, planning a transport network, identifying areas with high economic potential.
- Communication and education: an interactive map facilitates data sharing with a non-expert audience.
- Predictive analysis: algorithms integrated into modern software allow anticipating the evolution of a territory (urbanization, flows, attractiveness…).
In short, mapping is no longer just a visualization medium: it is a true territorial intelligence tool.
Catchment areas: an emblematic use case
One of the most common uses of mapping software in the economic world concerns the study of a catchment area. This concept refers to the geographic area from which the clientele of a point of sale, business, or service originates.
Thanks to mapping, it is possible to:
- Draw catchment areas based on customer addresses or postal codes.
- Analyze competition in a given area.
- Estimate consumption potential of a geographic sector.
- Cross-reference sociodemographic data (income, age, purchasing habits, population density).
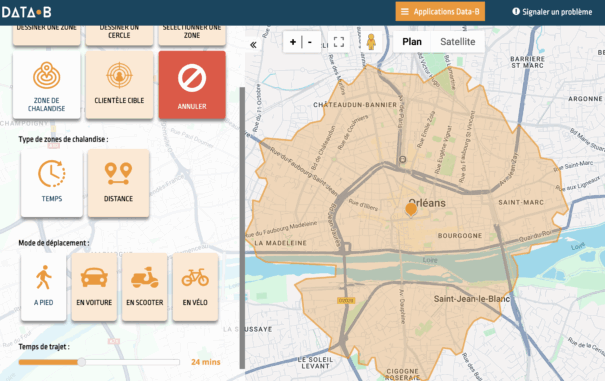
Specialized software allows calculating catchment areas using several methods:
- Isometric: based on travel time (5, 10, 15 minutes around a point).
- Isodistance: according to distance in kilometers.
- Based on actual clientele: by geolocating recorded addresses.
This approach offers a concrete vision of the consumption basin, and helps better target marketing campaigns or evaluate the interest of a commercial establishment.
Mapping and data: a powerful combination
The evolution of data technologies has revolutionized mapping. Today, software no longer merely visualizes points on a map: they exploit large volumes of geographic and statistical data to produce in-depth analyses.
Public databases (such as INSEE, OpenStreetMap, or BAN) serve as the foundation for many software, but private actors add a layer of intelligence: segmentation, scoring, predictive models, dynamic indicators…
It is precisely within this logic that tools like Data-B fit, a mapping and geomarketing analysis platform dedicated to commercial real estate and franchising. Data-B allows exploiting territorial data to:
- Identify the best implantation zones.
- Understand pedestrian and vehicular flow structures.
- Study the local economic fabric (brands, rents, turnover…).
- Produce automated local market reports based on reliable data.
Without replacing classic GIS, this type of software illustrates the growing specialization of mapping towards concrete professional applications.
New trends in digital mapping
Mapping is undergoing a true technological revolution. Three major trends emerge:
1. Artificial intelligence and spatial prediction
AI algorithms now allow detecting correlations invisible to the human eye: links between commercial flows, vacancy of premises, neighborhood attractiveness… Software integrates predictive models capable of estimating the future performance of a site or area.
2. Collaborative mapping
Thanks to open data and contributory platforms like OpenStreetMap, the map becomes a collective tool. Data can be enriched, corrected, and shared by users themselves.
3. Immersive experience
Augmented reality and 3D are progressively establishing themselves in mapping software. Visualizing an urban area, a development project, or a catchment area in 3D allows a finer understanding of spatial dynamics.
The most used software today
The mapping software market is divided between open source tools, professional solutions, and specialized platforms:
- QGIS: free and powerful software, used worldwide.
- ArcGIS: the global reference in professional GIS.
- Google Maps Platform: widely used for web applications and mobility.
- MapInfo: a historic tool for geographic data management.
- Data-B: an analytical mapping platform focused on commercial real estate and franchising issues.
Each meets specific needs. QGIS and ArcGIS are mainly aimed at GIS experts, while Data-B or MapInfo target field professionals wishing to exploit mapping without advanced technical skills.
Benefits for businesses and communities
For a company, mapping software becomes a true strategic lever:
- It helps optimize commercial prospecting by identifying high-potential areas.
- It allows monitoring the evolution of a network of points of sale.
- It serves to understand the spatial behavior of consumers.
- It facilitates logistical and territorial planning.
Local authorities, for their part, use mapping to:
- Manage land use planning.
- Monitor urban projects.
- Visualize the distribution of public services or infrastructures.
- Communicate more effectively with citizens.
Towards the democratization of mapping
The era when mapping required complex and costly software is over. Modern platforms, often online, now make map creation intuitive, fast, and accessible. In just a few clicks, it is possible to import data, generate catchment areas, or obtain precise indicators on a given territory.
This democratization of mapping opens new perspectives: every company, community, or citizen can now appropriate the reading of territory and draw concrete lessons from it.
Conclusion
Mapping software today stands as a pillar of territorial knowledge. From urban management to commercial real estate, including local marketing, it allows exploring spatial dynamics from a new angle. By making data readable and actionable, these tools transform the way we plan, decide, and communicate.
Platforms like Data-B demonstrate how mapping has become a universal language between data and territory. At a time when the boundaries between digital and real are fading, knowing how to read a map is above all knowing how to understand the world around us.