Origins and Evolution of the French Administrative Map
Looking back to the years following the Revolution of 1789, it is understood that the current contours are not the result of a cartographic whim, but of a desire to rationalize the organization of the country. Faced with the former provinces of very unequal sizes and influences, the revolutionaries imagined a uniform division: each department was to offer its inhabitants quick access to the prefecture.
One might think that this project simply cut the map at random; in truth, the boundaries take into account the communication routes of the time, population basins, and natural landmarks (rivers, mountain ranges). The Cassini maps or those of the IGN later bear witness to this constant search for balance between ease of access and geographical coherence.
From the Revolution to Today
Over the centuries, some adjustments have modified the administrative landscape: the creation of Corsica into two departments, the emergence of overseas collectivities, and more recently, the merging of regions in 2016. Each reform triggered meticulous cartographic work, integrating hundreds of boundary modifications, often debated in regional councils.
The NOTRe law (New Territorial Organization of the Republic) crystallized this issue: reducing the number of regions from 22 to 13 in metropolitan France. This change was accompanied by massive cartographic revisions, sometimes provoking strong reactions from local elected officials, keen to preserve the identity of their territory. Cartographers had to juggle political constraints, geographical coherence, and citizen demands.
Current structure: departments and regions
The contemporary administrative map of France is read at two complementary scales. First, the 13 metropolitan regions to which 5 overseas regions are added. Then, the departmental level, numbering 101 (including 5 overseas). Each of these entities carries a number, a name inherited from geography or history, and often increasing specific responsibilities.
The 18 regions: distribution and responsibilities
The regions are now responsible for economic development, vocational training, regional transport, and manage significant investment budgets. The new regional maps sometimes combine territories with very distinct identities: Grand Est thus covers Alsace, Champagne-Ardenne, and Lorraine, three provinces with strong cultures and traditions.
- Auvergne-Rhône-Alpes: a very vast industrial and rural territory.
- Hauts-de-France: a dynamic border crossroads.
- Nouvelle-Aquitaine: from the Atlantic coast to the Pyrenees mountains.
These maps serve as a basis for regional planning schemes, where each shade of color delineates an intervention zone or a living area. For citizens, they allow visualization of the location of services: high schools, training centers, development agencies.
The 101 departments: role and numbering
Each department carries a two-digit number (or three for the overseas departments). This code is found on license plates, postal codes, and in INSEE statistical data. The number reflects the original alphabetical order, with some exceptions related to former modifications.
The departmental council manages middle schools, departmental roads, social assistance, and sensitive natural areas. At the map scale, these responsibilities translate into a fine network, ensuring proximity between the administration and users. Cartographers, when making these plans, ensure that the main roads appear to illustrate accessibility from one end of the department to the other.
Applications of the administrative map
This mapping goes far beyond the simple institutional framework. Urban planners, marketers, NGOs, social science researchers: all rely on this data to analyze, plan, or guide public policies. It is used to target an electoral campaign, plan the establishment of a business, or assess the impact of a new train line.
Territorial planning and statistical studies
Territorial research offices cross-reference the administrative map with socio-economic files to create detailed diagnostics. For example, they overlay the map of rural revitalization zones with demographic data to identify territories weakened by urban exodus.
- Local diagnosis: analysis of infrastructure and services according to each canton.
- Demographic projections: modeling future needs in health or education.
- Economic evaluation: locating activity hubs to attract investments.
Education, research, and GIS
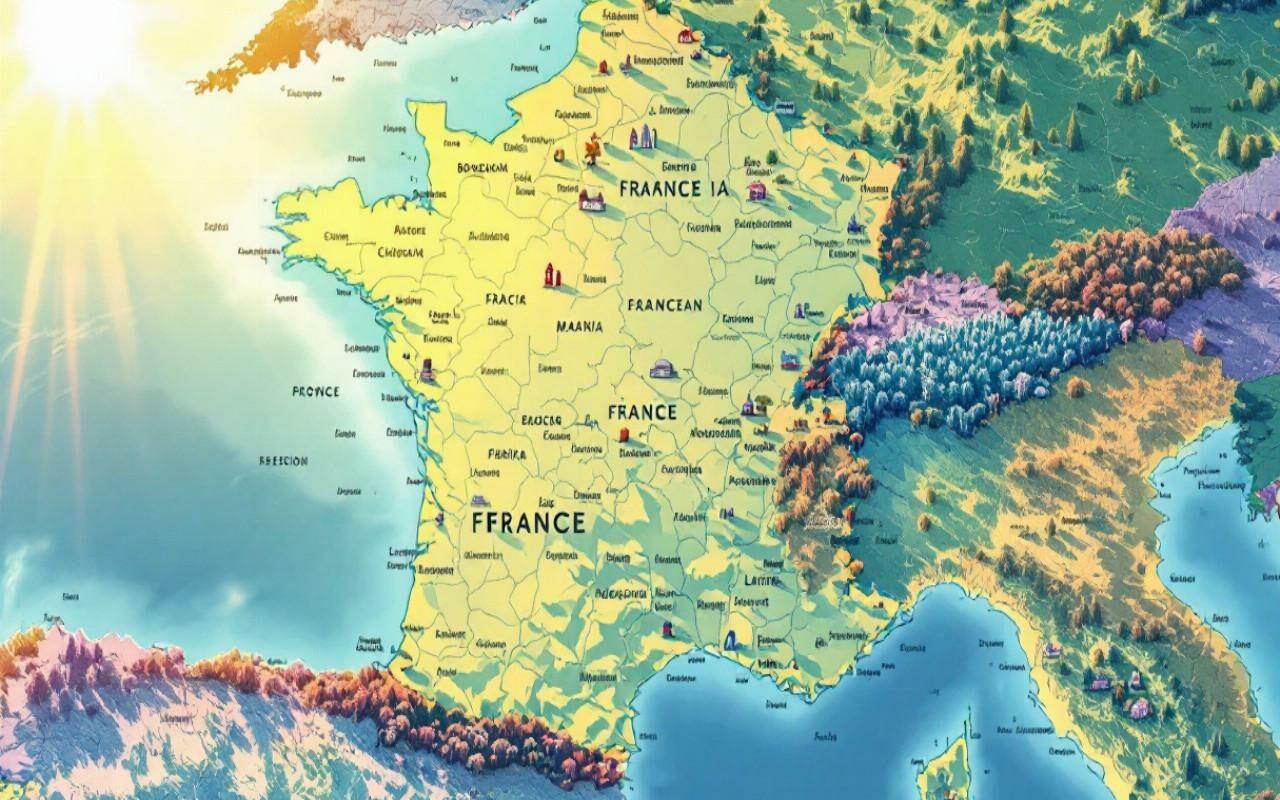
Universities teach the use of Geographic Information Systems (GIS) on official base maps. The image below illustrates a modern GIS, where departments are overlaid with layers of information (population density, forest cover, road networks).

In these contexts, the map is not fixed: it evolves with geodetic updates and ministerial decisions. According to IGN, territorial revisions represent several hundred corrections each year, an ant-like work necessary for data reliability.
Methods of creation and updating
Creating an administrative map requires gathering reliable geolocated data, often from GPS surveys, orthophotos, or airborne laser scans. These data converge into a centralized GIS, where each entity carries a unique identifier based on the INSEE code.
Software and databases
Professionals generally use QGIS or ArcGIS, coupled with IGN reference systems (BD TOPO®, BD CARTHAGE). These databases provide official boundaries, entity names, and attributes such as population or area.
“The geometric precision of these files often exceeds one meter,” notes a cartographic engineer from IGN. This advantage allows the production of precise maps for official documents or mobile applications.
Validation process
Each boundary modification is subject to a lengthy consultation process. Mayors, presidents of departmental councils, local associations: all can make observations. Once validated by decree, the new boundaries are integrated into the national GIS and deployed on various public service web portals.
Online Resources and Tools
Between public portals (data.gouv.fr, geoportail.gouv.fr) and specialized platforms, the supply of administrative maps is abundant. Some sites offer interactive tools to create your own thematic maps, for example in colors or hatching according to demographic criteria.
To view more detailed maps of France and explore other representations, do not hesitate to discover our detailed maps of France. This portal lists maps from various perspectives: historical, tourist, economic.
- Geoportail: 2D, 3D view, orthophotography.
- Data.gouv: shapefile downloads.
- Collaborative platforms: user contributions and rapid updates.
FAQ
- What is the difference between a region and a department?
- The region constitutes a higher level of coordination, while the department manages more local services (roads, middle schools, social assistance).
- How to access official files?
- On the IGN website or via data.gouv.fr, by searching for the BD CARTHAGE or BD TOPO® references.
- Why do maps change so often?
- Administrative boundaries evolve to take into account reforms, coastal erosion, or geolocation corrections.
- Can I freely reuse these maps?
- Most public data is under an open license (Etalab), but check reuse conditions before each use.
{
“@context”: “https://schema.org”,
“@type”: “WebPage”,
“about”: {
“@type”: “Thing”,
“name”: “Administrative map of France”
},
“keywords”: [“departments”, “regions”, “GIS”, “cartography”, “France”]
}