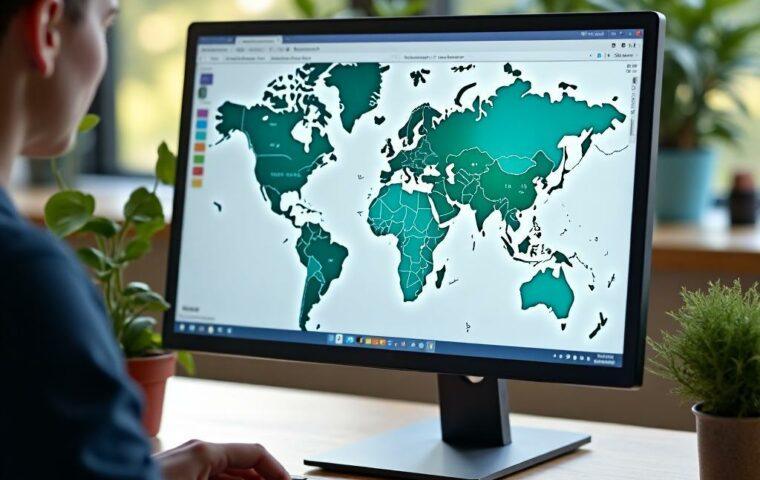
Digital minimalism is not an aesthetic, it is a method. Faced with the inflation of apps and widgets, choosing ten solid maps is enough to cover 90% of everyday decisions: getting information about a weather risk, checking mobile coverage, reading a local urban planning map, estimating a real estate purchase, anticipating a flood or a water restriction. This guide offers an operational and verifiable selection, sourced from public or semi-public organizations, regularly updated, with benchmarks to judge the reliability of the data.
Key point
A “useful” map checks three boxes: identifiable public source, clear update, possibility to export to keep a record.
Sommaire
How did we select these maps?
Four criteria guided the list: 1) recognized producer (State, independent authority, national operator), 2) update frequency and readable timestamp, 3) sufficient granularity at the address or municipality level, 4) existence of an export or sharing mode. For example, the fiber map “My Internet Connection” explicitly shows that its data comes from operator declarations as of March 31, 2025, while Arcep’s “My Mobile Network” specifies a refresh of statistics and the integration of 5G in its 2025 documents.
1) Géoportail (IGN): the reference base
The IGN cartographic portal gathers topographic backgrounds, orthophotos, administrative boundaries, and numerous thematic layers. It is the universal entry point to display a reliable background, measure distances, overlay layers, and print. For a hike, field reconnaissance, or a technical file, it is often the first tab to open.
Key point
Recommended starting point: Géoportail for the background, then add specialized layers as needed.
2) Géorisques: know the hazards around your home
The State website centralizes information on natural, technological, and mining risks. The interactive map allows exploration of floods, clay shrink-swell, cavities, landslides, radon, or seismicity at the municipal level. It is the tool to consult before a real estate purchase or a construction site.
Key point
Radon is the second leading cause of lung cancer in France, with about 3,000 estimated annual deaths: the dedicated map helps identify municipalities with potential.
3) Vigilance Météo-France: today’s alert
The four-color map from Météo-France continuously signals violent winds, storms, floods, heatwaves, snow-ice, waves-submersion, etc. It is a reference shared by security services and the media, useful for deciding on travel or adapting an event.
Key point
Green, yellow, orange, red: the vigilance coding has been national and harmonized since the early 2000s.
4) Vigicrues and Vigicrues Flash: monitoring the rivers
Vigicrues displays flood warnings for major rivers, territory by territory, with bulletins and alert flows. Additionally, Vigicrues Flash covers sudden floods on small watersheds and about 10,000 municipalities. For flood-prone areas, this is the map to keep as a favorite.
5) VigiEau: water restrictions and drought
This state platform aggregates prefectural decrees restricting water use. You can enter an address, allow geolocation, and subscribe to alerts to follow local developments. Useful for watering, construction, irrigation, landscaping companies.
6) Fixed and mobile connectivity: two Arcep maps to cross-reference
For mobile, “Mon Réseau Mobile” provides a 3G/4G/5G coverage map by operator and antenna locations. For fixed, “Ma connexion internet” and “cartefibre” detail available speeds at the address and the FttH deployment status. At the scale of a professional project or a move, these maps are decisive.
Key point
In 2025, Arcep enriched its representations of 4G coverage and integrated 5G statistics: remember to check the displayed update date.
7) Atmo-France: daily air quality
The Atmo network publishes a map of air quality indices, including pollens, with daily updates. Useful for sensitive groups, outdoor sports, or planning school activities.
8) DVF (Etalab): real estate transactions on a map
The DVF application maps actual sales from tax data, viewable by parcel, with date and price. For an estimate or neighborhood benchmark, it is an essential factual base. Supplement with Insee’s “Territory Comparator” tool for socio-demographic context.
9) Cadastre: parcel boundaries and urban planning easements
The computerized cadastral map allows you to search for a parcel by reference, view the sheets, and print. Coupled with the Urban Planning Geoportal, it clarifies zoning (U, N, A, etc.), public utility easements, and applicable rules. Essential whenever there is land, an extension, or a lot division.
10) BRGM InfoTerre: geology and subsoil
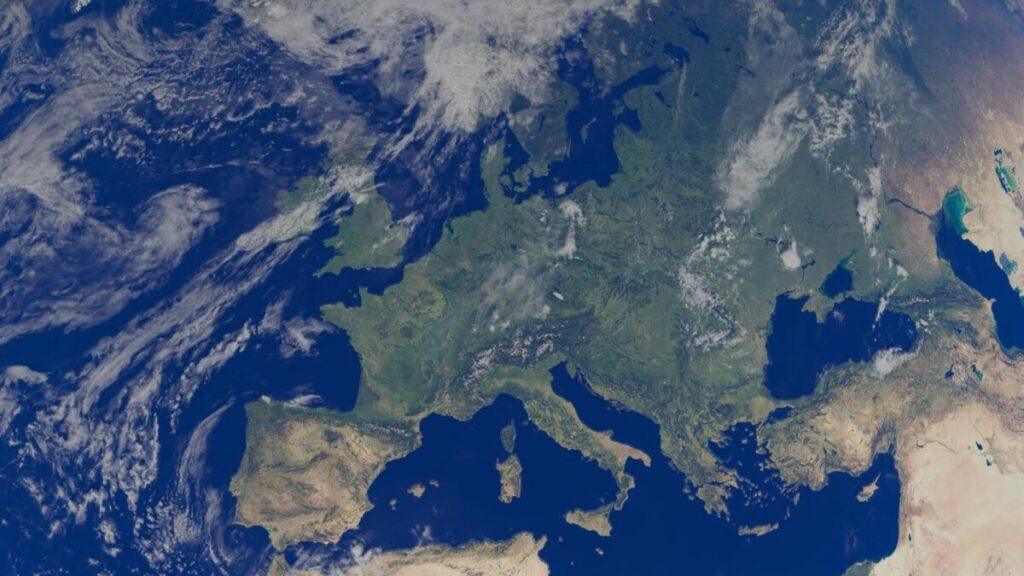
The InfoTerre portal provides access to geological maps, the Subsoil Bank, and thematic layers. To anticipate clay risk, choose a foundation system, or understand a spring, it is a technical but valuable resource.
Midway: how to freeze evidence and share it properly
For professional use, keep a record of your verifications. Exporting the map as displayed and annotating it allows you to explain a decision or document a file. In most public interfaces, a clean PNG capture is enough for an internal note or an email. For very detailed layers (cadastre, orthophoto), prefer exporting in PNG at the desired scale to ensure text readability and sharp boundaries. For a brochure, check that your PNG is at 300 dpi at the final size, and archive the date and original URL in the caption.
If you need to compose an A4 sheet with several extracts, a consumer software like Adobe is sufficient to juxtapose the blocks, add a caption, a north arrow, a graphical scale, and a source cartouche. The important thing is not the effect, but clarity: date, source, displayed layer, area, associated decision.
Key point
An undated map is an opinion. A dated and sourced map becomes evidence.
Quick method to judge the reliability of a map
- Who speaks: ministry, independent authority, national operator, public institute.
- When: visible update date, announced frequency. Example: DVF and Arcep explicitly detail the freshness of their data.
- Where: analysis scale appropriate to the decision (address, municipality, watershed).
- How: documentation of methods, access to notices, possible API.
- Why: does the map respond to a concrete decision (buy, rent, build, move, get medical care, protect oneself).
Key point
A map from I-don’t-know-who, without date, without notice: move on.
Use case: buying and renovating a property in a sensitive area
Let’s imagine buying a house by the river. We start with Géorisques for risks and prevention plans, then Vigicrues for vigilance and local history, VigiEau to know recurring restrictions, DVF for price history, Cadastre and Géoportail de l’Urbanisme for regulations, finally Mon Réseau Mobile and Ma Connexion Internet for connectivity. We finish with Atmo-France if sensitive to fine particles, and InfoTerre to validate soil nature. At each step, we export a screenshot, add the date, and archive it in a project folder.
Key point
The order matters: risk first, market next, regulation last. This avoids unpleasant surprises.
Why these maps became essential in 2025
Three trends converge. 1) Climate and extremes: earlier heatwaves and intense storm episodes make daily vigilance and flood knowledge more useful than ever. 2) Digital infrastructures: the quality of fixed and mobile connectivity conditions housing, remote work, and local competitiveness, hence the need for official, updated, and comparable maps. 3) Open data: public access to real estate transactions and cadastral databases improves market transparency. All these maps feed into a quick, reasoned, shareable decision.
FAQ
Can I rely on private maps that use public data?
Yes, if the source and date are clear. Otherwise, prefer IGN, Arcep, Météo-France, Géorisques, and ministerial portals.
How to know if a map is up to date for my exact address?
Look for a timestamp and the validity perimeter. For example: the fiber map indicates the reference date of operator declarations, and the weather vigilance specifies the publication date.
What is the difference between Vigicrues and Vigicrues Flash?
Vigicrues covers major rivers with a 24-hour warning; Vigicrues Flash targets sudden floods on small watersheds and covers about 10,000 municipalities.
Where to check seismic zoning or radon potential?
On Géorisques and associated thematic files; IRSN also provides references and notices.
I am preparing a permit file: which maps should I prioritize attaching?
Cadastral plan, PLU extract via the Géoportail de l’Urbanisme, and if needed the Géorisques page. Date and source each extract.