/* Css En-Bref */
Isochrones offer a fascinating overview of a location’s accessibility based on travel time. Around a municipality, they reveal in just a few clicks how quickly one can reach schools, shops, or hospitals. Behind this ease of use lie complex calculations, combining road data, speed profiles, and geospatial algorithms. Let’s dive into the core functioning of the road isochrone calculator and explore its practical applications.
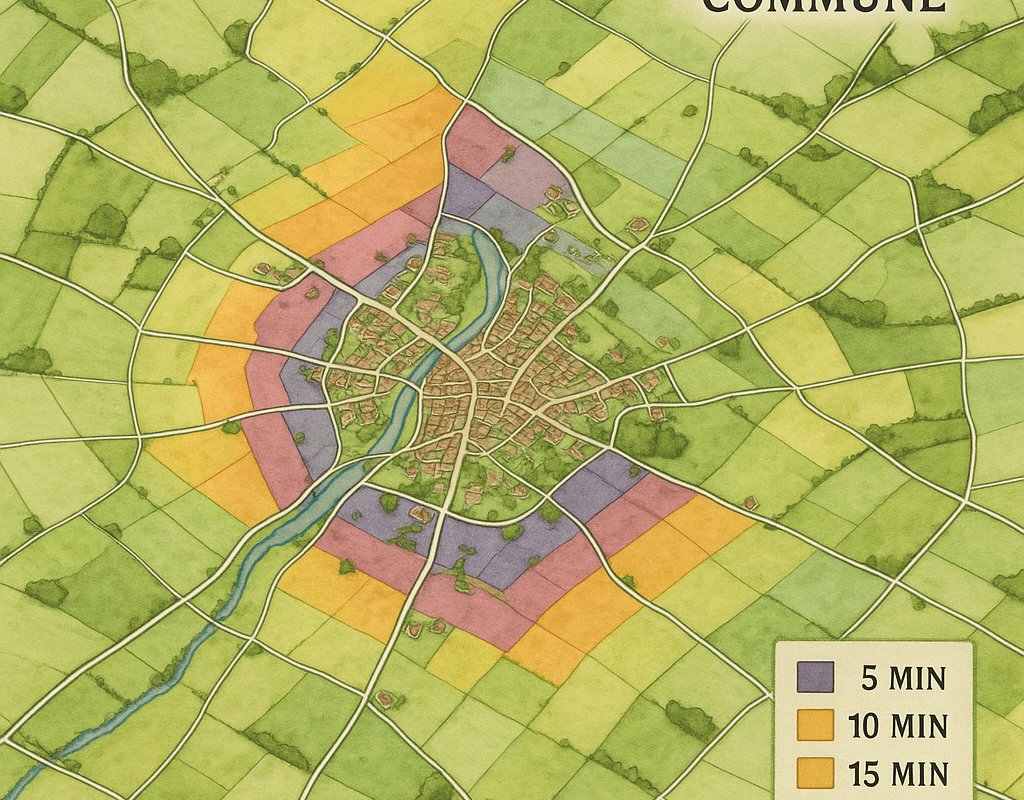
📍 Isochrones translate travel time around a given point into colored zones, making instant accessibility reading easier.
⚙️ These calculators integrate road data, driving profiles, and speed limits to draw reliable time curves.
💡 In urban planning or local commerce, they guide decisions: location of activities, distribution of public services, optimization of routes.
📊 Comparing multiple scenarios (car, bike, public transport) becomes child’s play: accessibility differences immediately stand out.
Sommaire
Why does a road isochrone calculator become essential?
Isochrones are often imagined as simple circles drawn on a map, but in reality, each curve results from a balance between the topology of the road network and the average speeds applied to each segment. Within a municipality and its surroundings, having these dynamic maps transcends traditional planning.
Visualize accessibility at a glance
Without a calculator, measuring accessibility requires tedious manual surveys or geometric approximations. The tool transforms this constraint into a clear visualization: in seconds, you know if a hospital is less than 10 minutes away by car, or if a business park is too far for a shuttle. This is pragmatic information that gains relevance, especially in municipalities where transport availability can vary greatly from one neighborhood to another.
Support public and private decisions
Municipal officials want to establish a new daycare? A retailer is considering a sales point in a peri-urban area? The isochrone answers the “who” and “when” questions: which population catchment is concerned, and how long does it take to access the service? This granularity allows prioritizing investments and precisely adjusting transport network coverage.
How does the road isochrone calculator work technically?
Originally, a geographic database (RGF, OpenStreetMap, or other) gathers roads, traffic directions, and speeds. The calculator feeds on this profile to generate road graphs, then explores these graphs from a central point, simulating a journey to each junction.
Essential Data and Preprocessing
- Vector road cartography: each segment is indexed with its type (highway, departmental road, path).
- Speed profiles and travel times: an average speed is assigned (e.g. 50 km/h in urban areas, 90 km/h outside urban areas) to each type of road.
- Restrictions and accessibility: one-way streets, limited zones (pedestrian or bike zones), time tolerances.
Calculation Algorithms: from Graphs and Dijkstra to A*
The most widespread remains Dijkstra’s algorithm, which progressively explores all accessible nodes in the road graph up to a maximum cost (time). For higher throughputs, one can use A* or hierarchical variants (Contraction Hierarchies) to speed up queries by preprocessing the most frequented roads.
Practical Applications In and Around the Municipality
The range of uses is broad: from urban planning to logistics, including the evaluation of medical coverage. Let’s examine some concrete cases.
- Territorial planning: identifying poorly served areas to prioritize investment in public transport.
- Commercial strategy: choosing the location of a drive-through, a store, or a local producers’ market.
- Emergency services: simulating actual intervention times for firefighters or emergency medical services depending on traffic.
- Soft mobility: comparing bike vs car isochrones and encouraging cycling routes.
Comparative Table of Key Parameters
| Parameter | Description | Impact on Isochrone |
|---|---|---|
| Average speed | Km/h applied according to road type | Expands or reduces the access area |
| Time limit | Maximum duration for calculation (min) | Sets the extent of the curves |
| Vehicle profile | Car, bike, PRM, public transport | Modifies the geometry of the usable network |
| Traffic data | Hourly flow or real-time | Refines the duration estimates |
Criteria for Choosing Your Isochrone Tool
Given the diversity of solutions (open source, SaaS, proprietary APIs), several elements guide the choice:
- Quality of maps: territorial coverage, update frequency, and consistency of speeds.
- Query performance: response time and capacity to process batches of points.
- Parameter flexibility: customization of speed profiles, addition of local restrictions.
- Cost and licensing: free models (OpenRouteService) vs paid subscriptions (GraphHopper Enterprise, Mapbox).
FAQ
What exactly is an isochrone?
An isochrone is a geographic contour connecting all points reachable from an origin point within a given time. Unlike a simple kilometer radius, it takes into account the structure of the road network and actual speeds.
Can a calculator be integrated into a WordPress site?
Yes, several plugins and APIs facilitate integration. You just need an API key (OpenRouteService, Mapbox, Here) and a plugin capable of consuming these services to display maps and isochrones directly in your pages.
Do traffic data really influence the results?
Absolutely. Without traffic data, the calculator relies on theoretical average speeds. With hourly or real-time flow, congestion is captured and more accurate isochrones are generated, particularly in dense urban areas.
What are the main algorithms used?
The most common are Dijkstra’s algorithm for its robustness, A* for its efficiency in directed search, and hierarchical methods like Contraction Hierarchies to speed up the processing of large networks.