2025 marks a methodological and political turning point for measuring and combating poverty. Institutions have raised the international threshold, conflicts and climate reshape vulnerability hotspots, and results vary greatly by region. Here is the factual and actionable status report.
The international poverty line has risen to $3 per day (2021 prices), replacing the former $2.15.
In 2025, ~808 million people live in extreme poverty, or ≈10% of the global population.
Poverty is concentrated in sub-Saharan Africa and in fragile and conflict-affected contexts.
“Working poverty” affects ~244 million workers in 2024; severe food insecurity concerns ~673 million people.
Cost-effective solutions exist: cash transfers, social protection, education, health, resilient agriculture, and peace.
Sommaire
Definitions and Methodological Change in 2025
In June 2025, the World Bank updated global poverty lines with 2021 purchasing power parities (PPP). The old $2.15 line (PPP 2017) was replaced by a $3.00 line per person per day (PPP 2021), accompanied by harmonized upper lines ($4.20 and $8.30) for middle-income countries. This increase does not mean that “the world suddenly became poorer”: it adjusts the international comparison benchmark.
A direct consequence: prevalence series and headcounts must be read with caution when comparing before/after 2025. Shares and numbers can mechanically increase with a higher threshold, even though the material reality of households has not changed. Official platforms (PIP) publish both generations of estimates and document series breaks, allowing for correct interpretation of medium-term trends.
To remember for 2025: referring to “extreme poverty” by default means $3 (PPP 2021). References to $2.15 must be explicitly indicated.
2025 Figures: Where Does Extreme Poverty Stand?
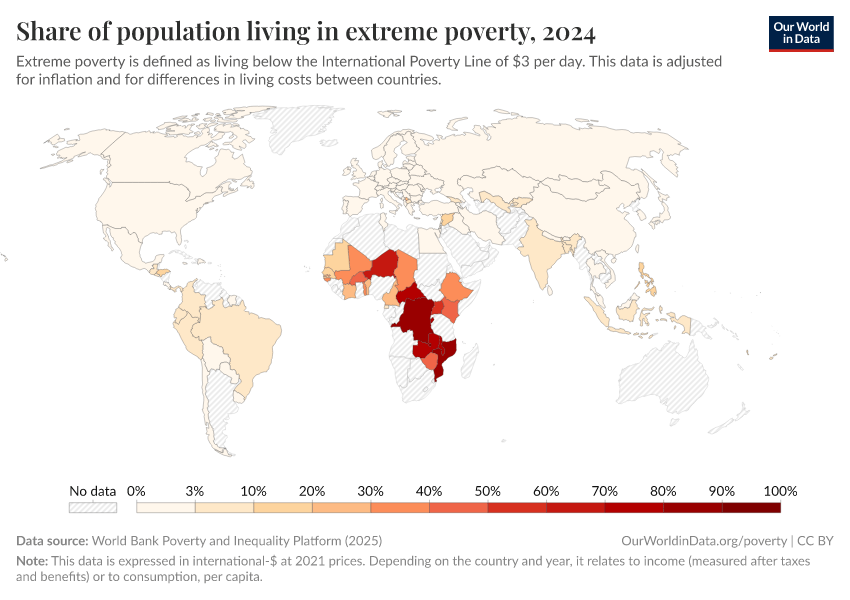
According to official 2025 estimates, about 808 million people will live this year below the international line, or ≈ 9.9% to 10.1% of the global population. The dynamics are mixed: poverty continues to decline slowly globally, but it concentrates more in certain regions and contexts.
Regional distribution: Sub-Saharan Africa shows the highest rates and concentrates a growing share of extremely poor people. The Middle East and North Africa expanded region (including Afghanistan and Pakistan in some 2025 classifications) is now the second most affected region proportionally. South Asia and East Asia have continued rapid reductions over two decades, although the size of populations remains significant in some countries.
Summary table of key indicators used in this assessment:
| Indicator (latest data point) | Value 2024–2025 | Scope | Source |
|---|---|---|---|
| Extreme poverty (3 $ line) | ≈ 10.1% in 2025 | World | World Bank, update 09/2025 |
| Number in extreme poverty | ≈ 808 million in 2025 | World | UN Stats, SDG 1 (2025) |
| Workers in extreme poverty | ≈ 244 million (6.9%) in 2024 | World (employment) | UN Stats (SDG 1, 2025) ; ILO WESO 2025 |
| People experiencing hunger | ≈ 673 million in 2024 (≈ 8.3%) | World | SOFI 2025 (UNICEF/FAO/WHO/WFP/IFAD) |
Drivers of poverty: growth, inflation, debt, conflicts, climate
Four main determinants dominate the 2025 situation:
- Slow and uneven growth: the post-pandemic recovery is uneven. Low-income countries have seen their catch-up slow down, limiting the creation of productive jobs and the rise in real incomes. Productivity gains remain low outside Asia.
- Inflation and shocks to food prices: despite a decline compared to 2022, cumulative inflation has permanently eroded the purchasing power of poor households, especially on food.
- Debt and budget constraints: debt servicing absorbs an increasing share of budgets in many low-income countries, which crowds out social spending and basic investments.
- Conflicts, fragility and climate: poverty is concentrated in contexts of fragility, conflict and violence (FCV). By 2030, more than half, and possibly up to two thirds, of extremely poor people are expected to live in these contexts. Climate hazards increase the frequency of income losses, especially in rainfed agriculture.
Poverty and employment: working poverty
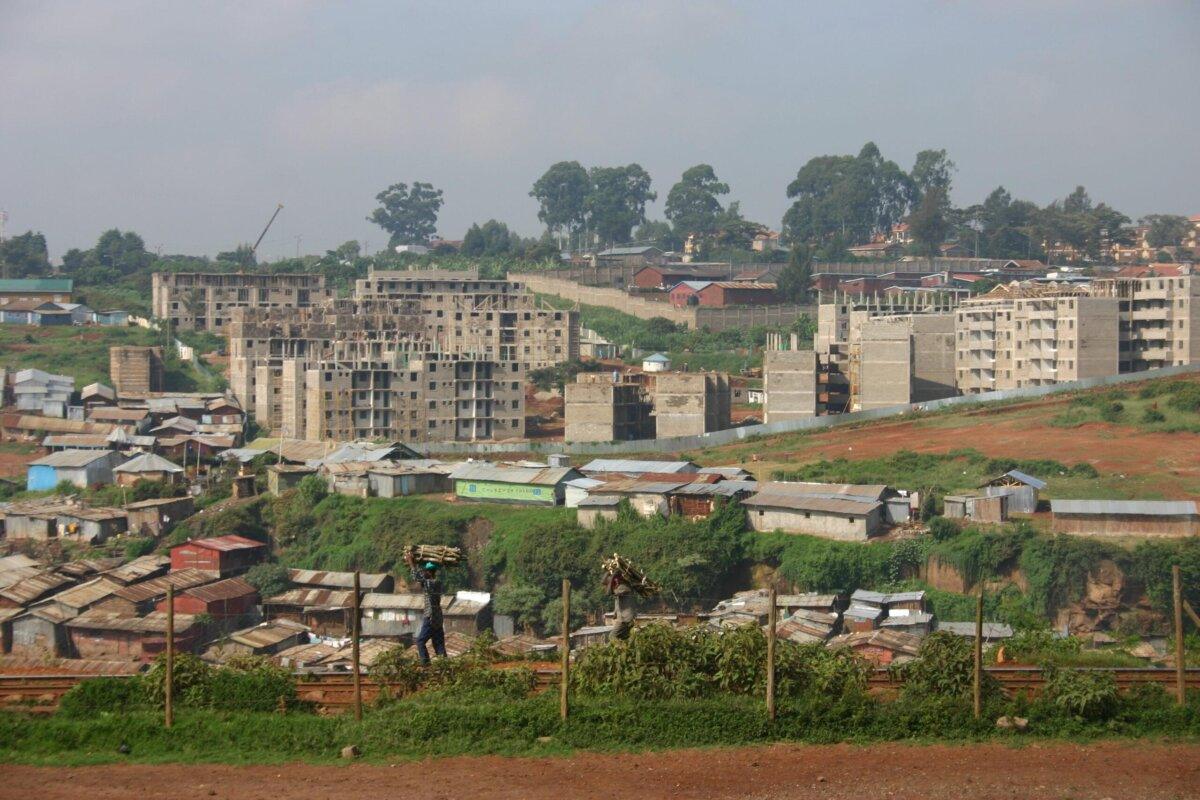
“Working” poverty persists: about 6.9% of workers worldwide still lived in extreme poverty in 2024, nearly 244 million people. Rates are significantly higher in the least developed countries and in the informal economy. Minimum wage policies, formalization, productivity of small enterprises, and expansion of social protection are decisive to reduce this phenomenon.
The central lever remains increasing labor productivity and paid hours, combined with safety nets that smooth shocks (illness, unemployment, seasonality) and prevent survival asset sales. Access to childcare, transport, and health multiplies the employment effect of economic policies, especially for women.
Poverty and hunger: the state of food insecurity
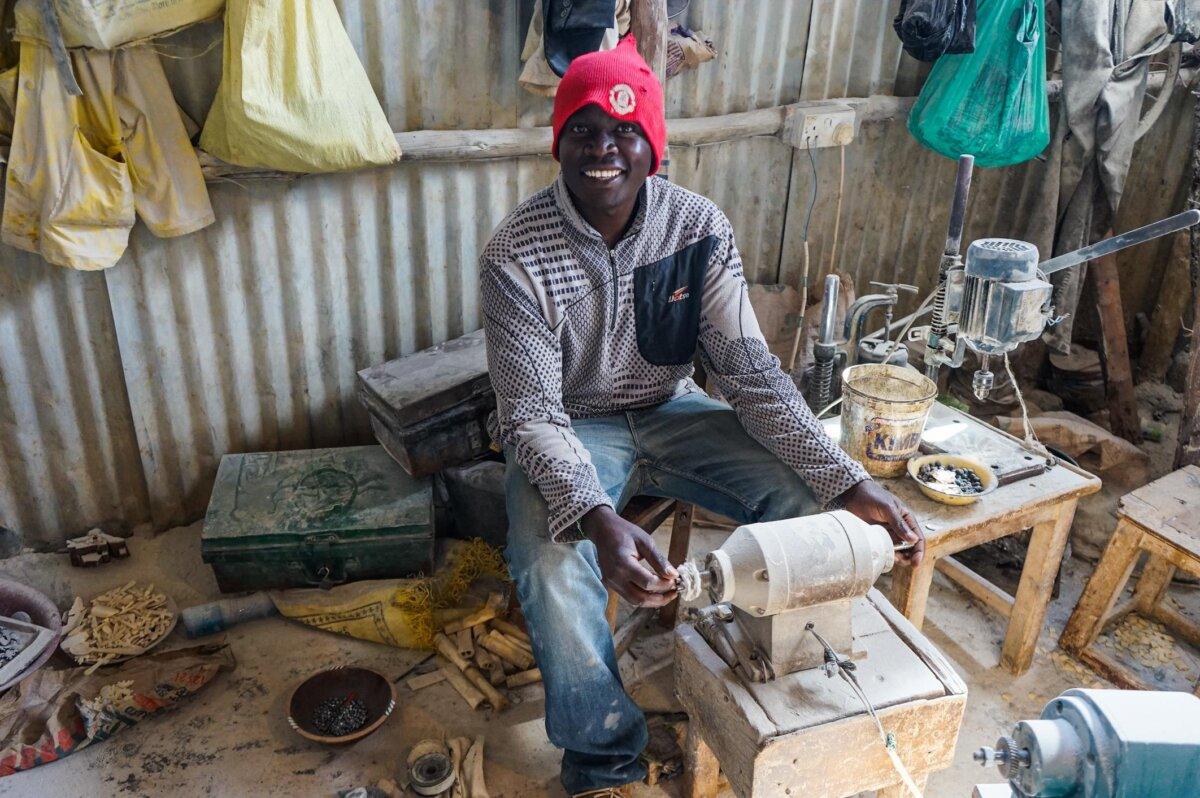
Hunger remains a critical marker of poverty. The SOFI 2025 report estimates that about 673 million people experienced hunger in 2024. The situation has slightly improved in South America and South Asia, but it is worsening in Africa, where more than one in five people are undernourished. Climate shocks, conflicts, and the high cost of inputs weigh on production and access to healthy food.
Link with monetary poverty: the $3 thresholds are below the cost of a healthy diet in most countries. In other words, just rising above $3 does not protect against food insecurity, especially without price, income, and social safety net policies.
Policies that work: evidence and magnitudes
Institutional evaluations and syntheses converge: a package of proven policies can sustainably reduce poverty, especially when targeting FCV contexts and poor rural areas:
- Cash transfers (conditional or not): rapid effects on consumption, food security, and productive investment of poor households, especially when predictable and banked.
- Basic universal social protection: social pensions, family allowances, minimal health insurance. Gradual expansion, financed by domestic revenues and concessional support, is considered macro-socially cost-effective.
- Investments in health and education: gains in years of schooling, human capital, and female labor market participation, with strong intergenerational effects.
- Resilient agriculture: efficient irrigation, improved seeds, digital agricultural advice, index-based climate insurance; priority to local food systems.
- Economic inclusion: start-up assets, training, coaching, and market access for micro-enterprises and ultra-poor households.
- Peace and governance: without reducing violence and fragility, SDG 1 is out of reach in several subregions.
Countries that have reduced poverty most rapidly combine these levers with employment-driven growth, rigorous management of fiscal stabilizers, and fine geographic targeting.
Data and tools to monitor poverty
For reliable and reproducible tracking of figures:
- Poverty and Inequality Platform (PIP): World Bank primary database, with methods, metadata, and nowcasting.
- Our World in Data: open visualizations, $3/4, $20/8, $30 lines, historical comparisons, and educational documents.
- UN Stats – SDG 1: official monitoring of progress towards 2030, including projections and decent work indicators.
- SOFI 2025: food insecurity, malnutrition, cost/affordability of healthy diets.
- World Bank – FCV: diagnostics and data on fragility and conflicts.
- Fact sheet: new 2025 poverty lines: Q&A on the shift to $3.
Trends towards 2030: what is needed for SDG 1
At the current pace, the UN projects that ≈ 7.3% of the world population will still be living in extreme poverty in 2030. Most of the “not reached” will be in sub-Saharan Africa and in FCV countries. To really accelerate, three conditions recur in analyses: (1) pacify and stabilize conflict zones; (2) re-accelerate inclusive growth through productivity, regional trade, and human capital; (3) finance basic social protection and climate adaptation, with targeted debt relief and domestic tax mobilization.
The raising of the threshold to $3 clarifies a reality often obscured: exiting “statistical” extreme poverty is not enough. The goal is the resilience of households to shocks and the ability to accumulate human and productive capital. The policies listed above contribute to this, if they are sustained and adapted to local contexts.
FAQ
Why is there talk of a new $3 per day threshold in 2025?
Because the World Bank updated the poverty lines with the 2021 PPPs. The $3 threshold (2021 prices) replaces the $2.15 threshold (2017 prices). This improves international comparability but creates a series break. See the official “global poverty lines” 2025 fact sheet.
How many people are in extreme poverty in 2025?
About 808 million people, or about 10% of the world population, according to the UN (SDG 1, 2025). The World Bank nowcasts give a range from 9.9% to 10.1% depending on updates.
Which regions are most affected?
Sub-Saharan Africa shows the highest rates. Fragility and conflict contexts concentrate a growing share of poor people, with intensification expected by 2030.
Does raising the threshold to $3 change the assessment of progress?
Yes. A higher threshold mechanically increases the measured prevalence. Therefore, direct comparisons with the $2.15 series without adjustment should be avoided. Official platforms document these series breaks.
Which policies have the most robust impact?
Cash transfers, basic social protection, health and education, economic inclusion, resilient agriculture, and upstream, conflict resolution. Effects are stronger when combined and geographically targeted.
What is the difference between monetary poverty and multidimensional poverty?
The first is calculated from an income/consumption threshold ($3). The second includes access to education, health, water, energy, etc. A household can be above $3 while still being poor in the multidimensional sense.
Sources
- World Bank – Update on Poverty Lines (June 2025)
- World Bank – Global Poverty Update (Sept. 2025)
- UN Stats – SDG Report 2025, Goal 1
Conclusion: overall progress is not finished, but it is too slow and too uneven to achieve SDG 1 without course correction. Priority to FCV contexts, basic social protection, and accelerating productivity with inclusion. The 2025 data offer a more demanding compass; it must be used to target better and invest more effectively.