What does the demographic projection for France really say for 2050?
The first pitfall is to confuse projection with certain forecast. A projection extends hypotheses on fertility, life expectancy, and migration; it does not promise that reality will follow exactly the same path. This is essential for 2050, because the national timeline seems relatively clear, whereas the departmental map remains very sensitive to residential mobility, local employment, housing costs, and even climate changes. In other words, one can describe robust trends, but not freeze the future commune by commune.
In the short and medium term, France remains driven by significant demographic inertia. According to the Insee interactive tool on population evolution and structure, the country has 69.1 million inhabitants as of January 1, 2026, including 66.8 million in metropolitan France and 2.3 million in the five overseas departments (DOM). However, this high level does not mean homogeneous growth. In many territories, the population increases because households settle there, not because more children are born. This is a decisive shift to understand the maps of 2050.
The second major fact is aging. It acts as a slow but very powerful force. In already aged departments, the number of deaths tends to increase faster than births, which worsens the natural balance. When arrivals do not compensate for this trend, the population decreases. Conversely, in areas that attract workers, students, young retirees, or families, the migratory balance can maintain growth even with a less dynamic birth rate than before.
Which regions will really gain inhabitants by 2050?
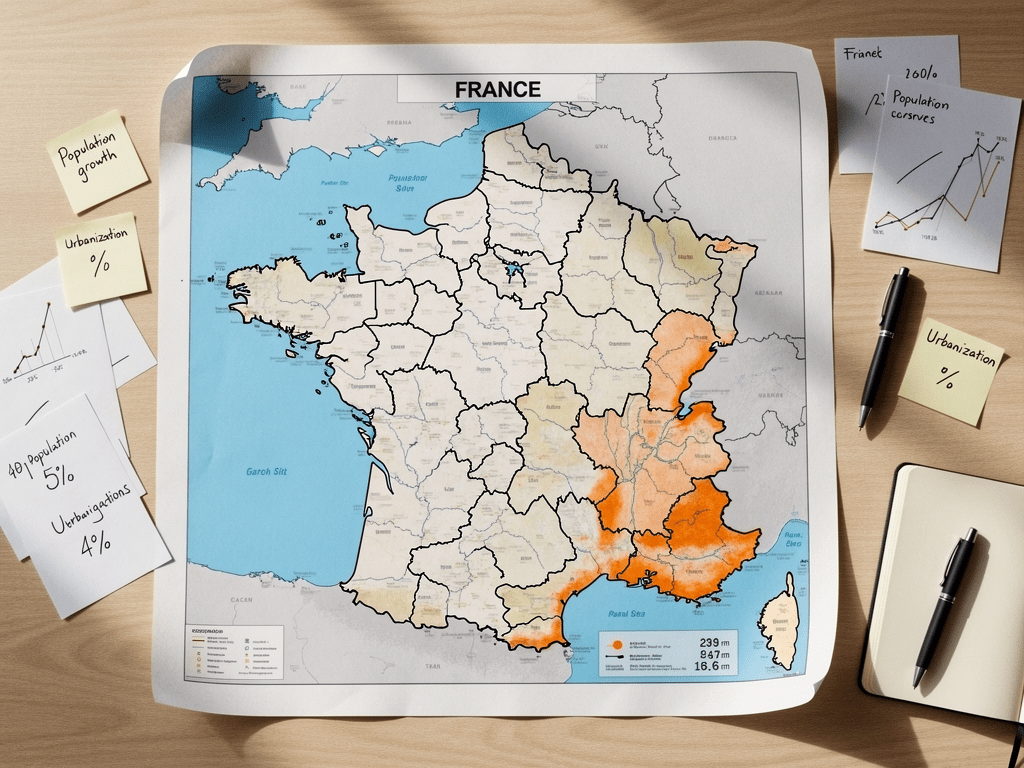
The regional maps converge on a fairly clear framework: the West, the South-West, the Atlantic coast, and several major hubs in the South should remain the winners of demographic redistribution. Occitanie concentrates a large part of this dynamic thanks to the Toulouse-Montpellier axis, universities, aeronautics, services, and a housing market that still attracts mobile households. Nouvelle-Aquitaine benefits from the Bordeaux magnet, but also from intermediate cities and a sought-after coastal frontage. Pays de la Loire remain well placed around Nantes, Angers, and the Vendée coast.
At the departmental level, winners are often easier to spot than losers because they combine several factors. Haute-Garonne, Gironde, Hérault, Loire-Atlantique, and Vendée regularly appear among the most dynamic territories, even if the intensity of growth may slow compared to previous decades. The logic is quite simple: a strong employment basin, higher education offerings, good transport links, a favorable residential image, and the ability to attract both workers and retirees.
One often underestimated point must be added: not all growth is the same. In some departments, the increase is due to a highly productive metropolis, such as around Toulouse or Nantes. In others, it relies more on residential mobility, a sought-after living environment, and real estate trade-offs. For those who want to link demography and economic attractiveness, the connection with income is useful: wage and job market disparities have a lasting influence on residential choices, as also shown by our comparison of average salaries by region in France.
The Provence-Alpes-Côte d’Azur region also remains in the probable growth zone, but with more contrasts. Coastal and metropolitan departments retain significant attraction power, while land tensions, housing costs, and mobility constraints can slow some settlements. Growth there is therefore less linear than one might think. It is not just a question of sunshine; it is also a question of the capacity to sustainably house new populations.
Which regions are likely to lose out, or rather stagnate?
The nuance is important: at the level of regions, some areas presented as “losers” could actually mainly grow more slowly than average, or even plateau, whereas at the level of departments, declines are already more visible. This is particularly true in the Grand Est, parts of Bourgogne-Franche-Comté, Centre-Val de Loire, and several areas of the Massif Central. The problem is not only economic: it is the combination of an unfavorable age pyramid, departures of young adults, and insufficient arrivals to compensate.

In these more fragile territories, certain names often come up in local analyses: Ardennes, Haute-Marne, Nièvre, Creuse, or some departments in the center-east. Again, it is important to avoid oversimplification. A department can lose inhabitants while seeing its elderly population increase, which profoundly changes public needs. Schools sometimes close while the demand for healthcare, adapted mobility, and home care rises. Demographic decline therefore does not necessarily mean a reduction in expenses; on the contrary, it can make some services more costly per inhabitant.
The case of the Grand Est deserves special attention. This region combines well-connected urban areas and departments where demographic erosion can settle more durably. Hubs like Strasbourg or Reims obviously do not have the same trajectory as rural areas far from major centralities. That is why departmental maps are more telling than regional averages: they show that the decline is not uniform but selective.
It is observed on the ground that the most exposed departments are not always the most geographically isolated; they are often those that combine low generational renewal, few arrivals of active households, and strained service offerings. The climatic factor could indeed partially reshuffle the cards in the long term, especially for agriculture and certain residential mobilities, a point to be considered alongside our analysis on climatic zones and their impact on agriculture in France.
How to read a departmental map without making mistakes?
Projection maps can sometimes be misleading because they color different realities in the same way. A population increase of +5% does not have the same meaning in a very young metropolitan department as in a coastal department where the growth is mainly driven by retirees. Conversely, a moderate population decline can mask a rapid transformation of the age pyramid. For a local elected official, a developer, an employer, or a family, this is not the same interpretation at all.
The first indicator to look at is therefore the natural balance, that is, the difference between births and deaths. In many territories, it is the first to reverse. The second is the migratory balance, in other words the difference between arrivals and departures. It is often the one that saves growth in attractive departments. The third indicator, more structural, is the share of 20-64 year olds and 75 years or older, as it conditions employment, health, housing, and public facilities.
| Type of territory | Likely trend by 2050 | Departments or examples | Main driver |
|---|---|---|---|
| Highly attractive metropolises | Sustained growth, sometimes slowed | Haute-Garonne, Gironde, Loire-Atlantique | Employment, studies, internal migrations |
| Residential coastal areas | Moderate to strong growth | Vendée, Hérault, Charente-Maritime | Quality of life, retirees, teleworking |
| Stabilized urban regions | Limited growth or stagnation | Part of PACA, Normandy | Attractiveness versus housing cost |
| Aging rural departments | Frequent decline | Creuse, Nièvre, Haute-Marne | Negative natural balance |
| Former dispersed industrial basins | Stagnation or decline | Ardennes, some sectors of Grand Est | Departures of young workers |
Another mistake is to assume that the richest departments will mechanically be the most dynamic. The relationship exists, but it is not automatic. Some areas gain inhabitants because they offer a good compromise between income, housing cost, accessibility, and living environment. Others, although very productive, may see their growth slowed by real estate pressure. To complement this macro reading, our article on the GDP per capita of France and its neighbors helps to place territorial performance in a broader economic context.
Why do some areas still attract despite the decline in birth rates?
The public debate often focuses on the decline in births, whereas the geography of 2050 is largely shaped by internal migrations. A region can lose natural dynamism and still continue to grow if it attracts households from elsewhere. This is particularly true for the Atlantic arc, some cities in the Southwest, and several Mediterranean departments. The driver is not only economic in the strict sense; it mixes income, climate, travel time, access to services, and the relative cost of real estate.
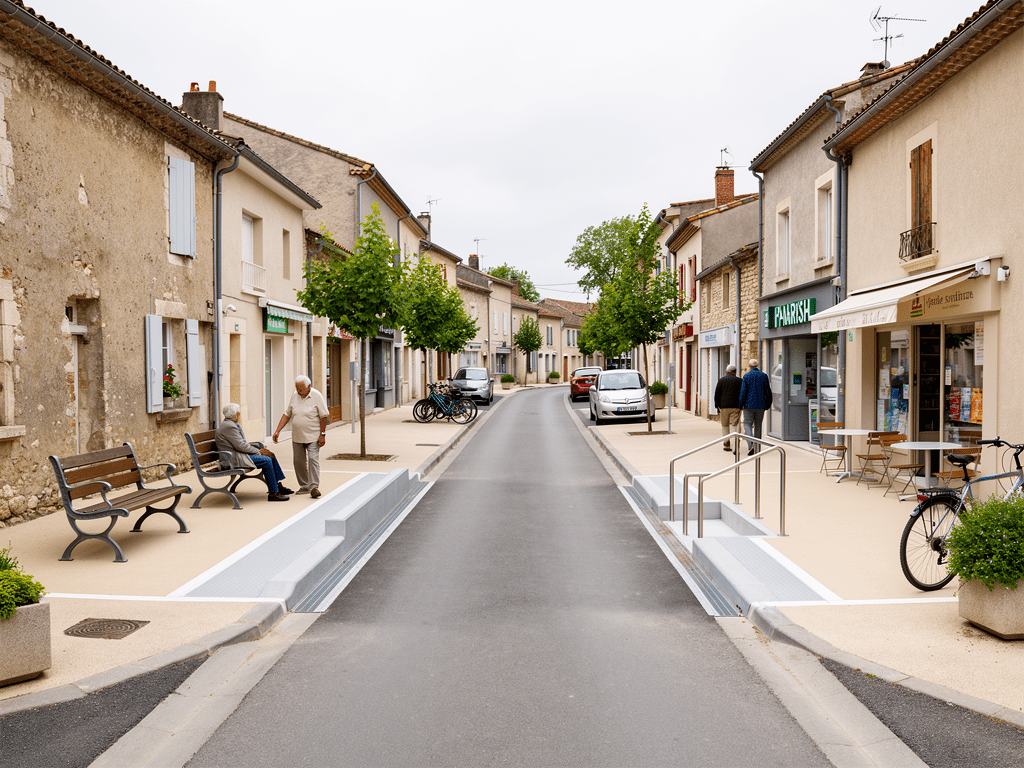
Teleworking has added an additional layer to this logic. Without completely overturning the map, it has made possible choices that were rarer before: living further from a major center, targeting a better-connected medium-sized city, or choosing a more affordable suburban ring. This benefits some already attractive departments, but also intermediate territories that were not at the top of the rankings ten years ago. Growth therefore sometimes spreads beyond the metropolises alone.
France in 2050 will not simply be divided between regions that gain and regions that lose. It will mainly oppose territories capable of attracting residents of studying, working, and consuming age to others where demographics will be increasingly dominated by age.
Finally, it must be recalled that residential attractiveness is not guaranteed. A department can gain inhabitants during a favorable market phase, then slow down if housing becomes too expensive, if infrastructures become saturated, or if access to services deteriorates. In other words, demographic growth is not only received; it must be managed. This is a very concrete challenge for local authorities who must anticipate needs in schools, water, transportation, and land.
Which departments should be closely monitored by 2050?
If the departmental maps had to be summarized into a few categories, four groups deserve particular attention. First, departments with very strong attraction such as Haute-Garonne, Gironde, Hérault, or Loire-Atlantique, because they will have to absorb growth without degrading their quality of life. Next, coastal or residential departments such as Vendée or Charente-Maritime, where growth may be accompanied by accelerated aging. The third group is intermediate departments near large urban areas, which can benefit from residential spillovers. Finally, structurally declining departments such as Creuse, Nièvre, or Haute-Marne, where the priority is less on growth than on maintaining services.
In practice, these trajectories produce very different maps depending on public policies. A population decline in a rural department can become manageable if mobility, access to healthcare, and digital technology improve. Conversely, a department experiencing strong growth can become tense if housing prices rise faster than incomes and networks become saturated. Demographic projections therefore do not only say “how many inhabitants”; they also illuminate a territory’s capacity to absorb or cushion change.
For public actors, three questions become central: where to build, where to maintain schools, and where to strengthen healthcare offerings. In growing areas, the issue is often capacity. In declining areas, it is accessibility to services. The Action Cœur de Ville program, led by the ANCT and concerning 234 cities, well illustrates this logic of differentiated adaptation of territories to demographic changes. It is not a single response to population decline or growth, but a lever for local reorganization.
What these projections concretely change for residents and decision-makers
The main lesson from the projections is that a generally stable France can produce very unstable effects on the ground. In growing departments, the pressure shifts towards housing, transportation, water, schools, and community facilities. In departments that are declining or rapidly aging, the issues focus more on health, home care, constrained mobility, and maintaining a network of services. The total population volume is therefore never sufficient to define a public need.
For businesses, these maps also become labor market maps. A young and attractive territory not only offers more consumers; it also concentrates more potential workers and students. Conversely, an aging territory must deal with greater recruitment difficulties and more specialized service needs. Demographic projections should therefore be read alongside employment, salary, and accessibility maps, not in isolation.
Regarding households, the reading is simpler than it seems. A growing territory is not necessarily the best choice if housing costs and travel times become too high there. A stagnant territory is not doomed if it offers a good quality of life, solid services, and sustainable prices. The right question is not just “where is the population increasing?” but “where do growth or decline remain compatible with a viable living environment?” This is where the 2050 map stops being abstract.
FAQ
Will France really lose inhabitants before 2050?
Not in the sense of a general collapse in the short term. The central scenarios rather suggest a still high national level around 2050, with a peak around 2044 at approximately 69.3 million inhabitants, then a slight decline later. However, several departments may already decrease before that date.
Will the regions that are growing today necessarily be winners in 2050?
Not necessarily in the same proportions. An attractive region may continue to gain inhabitants while slowing down significantly if housing becomes too expensive or if infrastructure poorly keeps up. Tomorrow’s growth will depend as much on reception capacity as on current attractiveness.
Is aging more important than the decline in birth rates?
Both are linked, but aging has a particularly structuring effect because it increases the number of deaths and changes public needs. In some departments, even without a dramatic drop in births, the rise in seniors is enough to push the natural balance into the red.
Are all rural departments doomed to decline?
No. Some rural or semi-rural territories can stabilize thanks to residential mobility, teleworking, a nearby medium-sized city, or a good level of services. However, very aging and poorly accessible departments remain the most exposed to a lasting decline.
Why do we talk more about departments than regions?
Because the regional scale often masks internal contrasts. A region may seem stable while it includes both a rapidly growing metropolis and several declining departments. For public action, the departmental level is often more operational.
Where can the most reliable sources be found to follow these projections?
The most solid references remain the publications of Insee, Ined, and the summaries from Vie-publique. It is preferable to follow updates by scenario and by territory, as a projection is always conditioned by assumptions about fertility, mortality, and migrations.