
| Key Points | Details to Remember |
|---|---|
| 🎯 Definition | Custom map: representation adjusted to your needs |
| ⚙️ Tools | QGIS, Inkscape, GeoJSON, or online editors |
| 🗺️ Formats | SHP, GeoJSON, KML depending on your use |
| 🎨 Styles | Colors, symbols and custom typography |
| 🔍 Data | IGN, OpenStreetMap or official sources |
| 🚀 Steps | Import, configuration, style, export and sharing |
Are you considering creating a unique map of France, whether it is an infographic for a report, a publication on your blog, or a custom thematic map? This guide invites you to explore each phase, from data collection to graphic formatting, without assuming prior expertise. You will discover how to structure the project, which software to adopt, and how to refine the details for a professional result.
Sommaire
Why bring your own map of France to life?
Creating a map yourself means stepping out of the frame of generic illustrations: you can highlight a territory, showcase local data, and offer a visual consistent with your graphic charter. An institutional website will gain credibility while an educational project will better capture attention thanks to adapted colors and annotations.
By combining geographic information and aesthetic choices, you control the visual narrative: whether it is a regional division, the transport network, or climate zones, each element can express itself according to your intentions. Rather than a simple map, it is a true communication tool.
Step 1: Gather and understand geographic data
Reliable sources for your data
While IGN remains the reference for precise data on the road network and administrative boundaries, OpenStreetMap offers unmatched flexibility, especially for secondary roads or localities. Portals like data.gouv.fr also host shapefile (.shp) and GeoJSON files free of rights.
Preferred formats
Depending on the chosen tool, you generally work with:
- Shapefile (.shp): GIS standard, compatible with QGIS.
- GeoJSON: ideal for web and JavaScript scripts.
- KML: Google Earth format, suitable for presentations.
Before any import, check the projection system (often Lambert 93 in metropolitan France) to ensure geographic alignment.
Step 2: Choose and install your tools
Technically, two approaches coexist: desktop software and online platforms. QGIS, open-source and comprehensive, is suited for intensive work; web services like uMap facilitate a first draft without installation.
- QGIS: robust, capable of assembling multiple layers, applying styles, and automating tasks with Python.
- Inkscape: useful for vectorizing, adding decorative elements, or retouching exported SVGs.
- Web tools (uMap, Mapbox Studio): intuitive interface, direct export in embed or image.
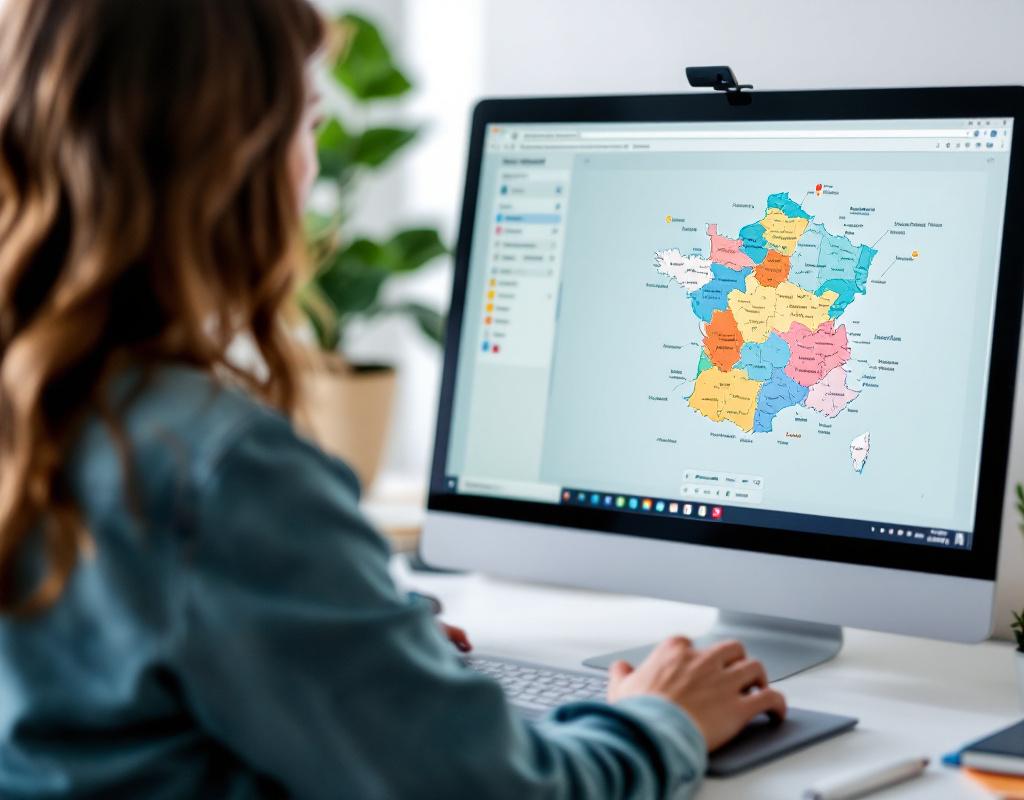
Step 3: Import, Georeference, and Prepare the Database
Once QGIS is installed, drag your shapefile or GeoJSON into the project window. If the projection does not correspond to Lambert 93, convert it via the menu Vector → Data Management Tools → Reproject Layer. The goal here is to create a clean layer:
- Remove unnecessary attributes in the Attribute Table.
- Rename the fields (for example region_name, pop_2020).
- Set display limits with the automatic legend or an SQL filter (Region = ‘Occitanie’ to isolate a territory).
This preparation avoids confusion during styling and reduces the final weight if you export to SVG.
Step 4: Style and Customize Elements
Your map takes shape when colors and symbols are applied. QGIS offers the Rule-based rendering engine to assign a style according to a field value (for example gradient colors based on population). In Inkscape or Illustrator, you can refine:
- Thickness and color of borders.
- Hatching or patterns for protected areas.
- Dynamic labels: font, size, and position adjustable.
To add depth, using drop shadows and transparency effects will highlight certain regions without overloading the legend.
Step 5: Export and Integrate Your Map
Depending on your final need, several formats are available to you:
| Format | Advantages | Recommended Use |
|---|---|---|
| PNG/JPEG | Ready to use, lightweight | Blogs, presentations |
| SVG | Vector, resizable | Printing, interactive web |
| GeoJSON/KML | Dynamic data, collaborative | Web applications, geocoding |
Exporting to SVG preserves vector detail: right-click and “Save as”. To embed on a website, you can also host an interactive GeoJSON using a JavaScript library (Leaflet, Mapbox GL).
Resources and Inspirations
Before concluding your creation, feel free to browse various examples. On the platform Cartographies de la France, a large gallery illustrates thematic approaches: economic, historical, or cultural.
“Each map tells a different story,” reminds the team at cartes-2-france.com, emphasizing the importance of the intention behind each style.
Frequently Asked Questions
Which tool is the most accessible for beginners?
uMap allows you to drag and drop your data without installation. For finer control, QGIS remains essential but has a learning curve.
How to choose the right colors?
Opt for palettes from Color Brewer or Coolors, adapted to quantitative or qualitative values. Consider accessibility for colorblind users by checking contrast.
Can I update my map after publication?
If you embed a GeoJSON via Leaflet or Mapbox, just replace the source file. For a static SVG, you will need to re-export in your editor.
Must the data be royalty-free?
Yes, unless you have a specific license. IGN offers paid licenses while OSM or data.gouv.fr provide public data.
{
“@context”: “https://schema.org”,
“@type”: “WebPage”,
“about”: {
“@type”: “Thing”,
“name”: “custom map creation of France”
},
“keywords”: [“custom map”,”France”,”GeoJSON”,”QGIS”,”shapefile”]
}