
| Key Points | Details to Remember |
|---|---|
| 🍎 Definition of the Topic | Understand the subject and context of the controversy. |
| 🗺 Main Issues | Identify the economic, social, and cultural consequences. |
| ⚖ Arguments in Favor | Assess the need to modernize the administrative division. |
| 🔍 Recurring Criticisms | Spot the flaws in the current structure. |
| 🔄 Paths for Evolution | Explore different redistricting scenarios. |
| 🌐 Concrete Applications | Visualize foreign models and cartographic tools. |
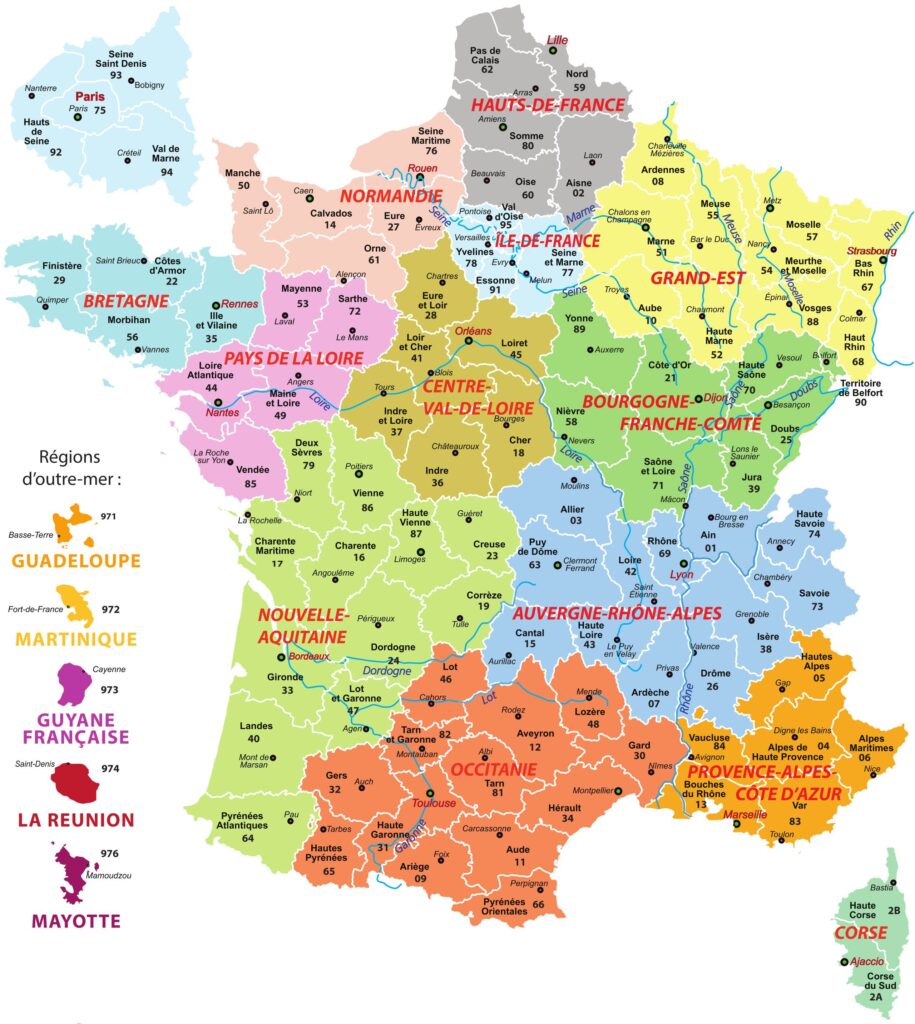
The administrative map of France serves more than just a graphic role: it crystallizes political organization, historical legacies, and territorial disparities. From the departments created in 1790 to the regions reshaped in 2016, each change sparks debates and resistance. Some advocate for a complete overhaul, arguing that demographic, economic, and environmental realities have evolved. Others fear the dilution of local identities and the complexity of a new system. This article unfolds the thread of this controversy: from the origins of the division to foreign experiences, from persistent criticisms to proposals for redesign.
Sommaire
Historical Context
In 1789, the Ancien Régime underwent a profound questioning. Revolutionary circles decided to replace provinces and parishes with departments, designed to be equitable, easier to administer, and to reduce the influence of local elites. The goal was clear: erase feudal boundaries, bring the State closer to the citizen, and facilitate tax collection.
Over the 19th and 20th centuries, this scheme was enriched by the creation of communes, districts, and later, regions. Each administrative layer responded to new needs: economic coordination, territorial planning, rural development. Yet, the layering of structures eventually generated complexity and redundancies.
From Royal Maps to Revolutionary Departments
Before the Revolution, the Cassini maps depict a fragmented France: duchies, counties, abbey lands. The revolutionaries drew inspiration from this geometry to create circular departments, conceived as spokes symptomatic of an ideal of equality. No one was to be more than a day’s ride on horseback from their prefecture.
Evolution Since 1790
Industrial crises and rural exodus shifted the demographic center of gravity. Cities once secondary became metropolises, while some rural areas depopulated. The reforms of 1982, 2015, or 2016 attempted to adapt the regions to these new realities, without altering departmental boundaries. The original division remains largely intact.
Why Question the Current Map?
At first glance, the administrative map seems stable. Yet, multiple signals indicate that it no longer corresponds to current dynamics. Employment basins exceed departmental limits, living areas are reorganizing around regional metropolises, and digital flows redraw invisible territories. The frozen map no longer reflects daily mobilities.
Elected officials from certain regions also point out the weakness of their political weight when they are in the minority compared to more populous areas. Conversely, departments with low population density demand compensation to maintain public services and infrastructure. Overhauling the division could seek a new compromise between representativeness and efficiency.
Territorial disparities
In eastern France, some departments are experiencing a strong exodus while others, close to urban centers, overflow with activity. This asymmetry raises the question of fairness: why finance vulnerable areas and very dynamic basins in the same way?
Economic and demographic weight
The Île-de-France and Auvergne-Rhône-Alpes regions concentrate a disproportionate share of the national GDP. A redrawing could better balance the redistribution of resources and representation within institutions.
Main criticisms
Several reservations systematically recur in the debate:
- The risk of breaking local identities rooted for centuries.
- The logistical complexity and administrative cost of an overhaul.
- The fear of political and electoral reprisals.
- A poorly defined transfer of competences between local authorities.
Beyond these obstacles, some sociologists remind that the map is above all a framework of representation: changing its geometry influences the sense of belonging and social cohesion.
Towards a overhaul?
Several scenarios emerge according to experts. On one side, a minimalist redrawing that would group a few peripheral departments to create economically viable units. On the other, an ambitious overhaul modeled on living areas and commuting flows, even if it means completely redefining the regions.
- Conservative scenario: merge 10 to 15 sparsely populated departments without touching the regions.
- Moderate scenario: recombine the regions by integrating 20 to 30 departments according to economic logics.
- Bold scenario: create new interregional zones, organized around cross-border metropolises.
Each option raises political issues: elected officials fear losing their influence, citizens dread a more distant administration. Advocates of modernity see it as an opportunity to simplify public management.
Political and social issues
This overhaul would touch the heart of local democracy. Who would decide the new borders? What consultation mechanisms should be adopted to involve citizens and local authorities? The scale of the debate goes far beyond technical services: it questions how participation and territorial anchoring are conceived.
Foreign examples
Several countries have taken the step. The United Kingdom, in 1974, reorganized its counties to create “metropolitan units” and “non-metropolitan units.” Germany is structured around Länder and Kreise, adapted to economic disparities and inter-municipal solidarity. In Sweden or Belgium, municipal mergers have been carried out to reduce the number of local elected officials and harmonize services.
| Country | Type of division | Strengths |
|---|---|---|
| United Kingdom | Metropolitan counties | Better urban coherence |
| Germany | Länder and Kreise | Inter-municipal solidarity |
| Sweden | Recompose municipalities | Reduction of redundancies |
These experiences show that rebalancing can rely on shared governance tools while preserving cultural particularities.
Impacts and perspectives
A map overhaul would generate several effects. First, a potential gain in efficiency: optimized public services, economies of scale, and a fairer budget distribution. Then, the possibility to adjust local development policies according to better-defined perimeters.
But beyond the technical aspect, it is the citizen perception that is at stake. Reshaping the map means offering a new territorial narrative, strengthening certain living areas, or bringing residents closer to their institutions. The challenge is to combine modernity with respect for roots.
How to visualize these changes?
To concretely understand these scenarios, interactive mapping tools prove indispensable. They allow overlaying current and projected boundaries, analyzing population flows, and measuring economic impact. To enrich your exploration, Cartes de France offers a library of map backgrounds and examples of divisions.
FAQ
1. Why is the French administrative map a subject of debate?
Because demographic and economic realities have changed since 1790, and the current division no longer always reflects the needs of the territories.
2. What are the main obstacles to a redesign?
The cost of transition, the fear of losing local identity, and the political complexity linked to the redistribution of powers.
3. Can we draw inspiration from other countries?
Yes, examples like the United Kingdom or Germany show that reorganization can improve coordination and services while preserving specificities.
4. What steps are there to consult citizens?
Local referendums, participatory workshops, and mapping simulations facilitate the co-construction of new boundaries.
5. Where can tools be found to visualize a possible redistricting?
On specialized platforms like Cartes de France, various geographic layers and analysis features help project redistricting scenarios.
{
“@context”: “https://schema.org”,
“@type”: “WebPage”,
“about”: {
“@type”: “Thing”,
“name”: “Renovation of the administrative map of France”
},
“keywords”: [
“administrative map”,
“territorial division”,
“administrative reform”,
“French regions”,
“departments”
]
}