Origins and Foundations of French Cartography
At first, the earliest sketches of the territory were fragmentary: Mediterranean sailors drew portolans, useful for coastal navigation but imprecise for describing the hinterland. Gradually, the Greco-Roman heritage, notably the works of Ptolemy, provided a more systematic framework. These primitive woodcuts laid the foundations for a gridded vision of space, where each degree of latitude and longitude offers a measurable milestone.
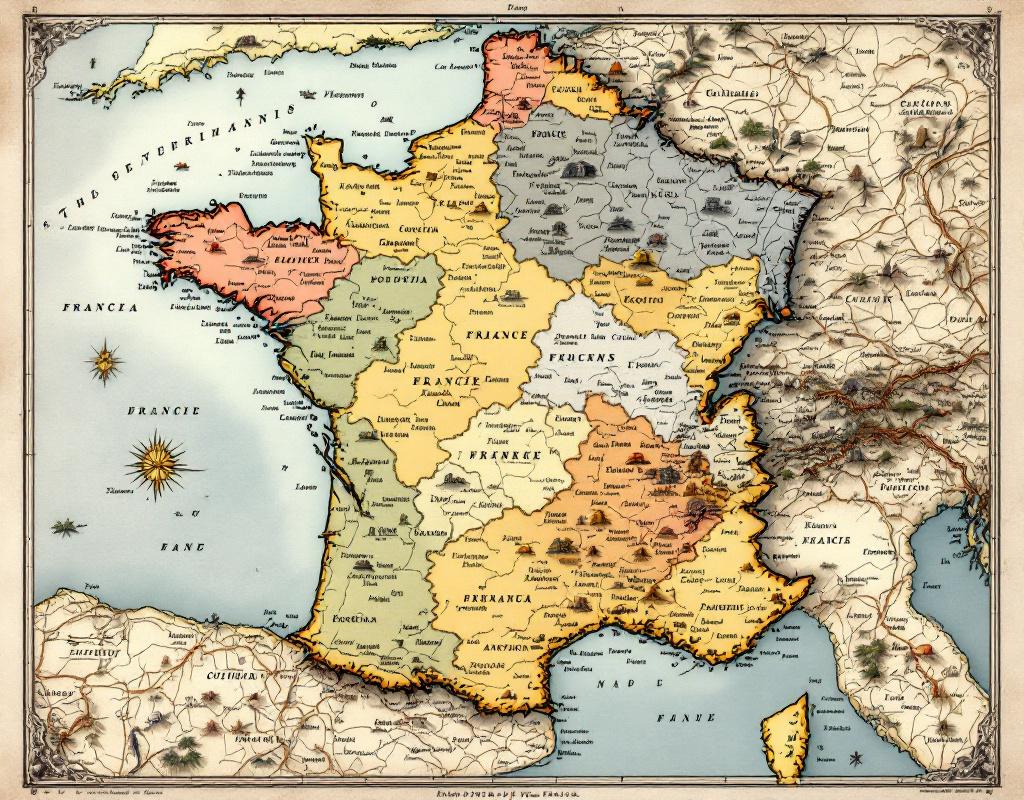
In the Middle Ages, mappemondes, often symbolic, incorporated religious motifs, placing Jerusalem at the center. Yet, on the French side, more utilitarian representations began to emerge: county maps, royal atlases. By the late 17th century, systematic surveying had to meet fiscal and military challenges. Cassini’s initiative, with his map drawn at 1/86,400 scale, illustrates this meeting of science and power: the State modernizes its borders as well as territorial administration.
The Map as a Driver of Geographical Evolutions
Territorial Planning and Major Routes
More than a descriptive element, the map serves as a guide for infrastructures. The 19th-century railways, for example, relied on meticulous surveys. Thus, the Paris–Lyon line was designed according to topographical constraints identified by engineers. Without cartographic surveys, it would have been impossible to anticipate slopes, tunnels, or viaducts.
On a more rural level, the rise of the Napoleonic cadastre is based on an exhaustive inventory of plots. By precisely delimiting each field, each vineyard or meadow plot, the map influences land distribution, guides crops, and permanently fixes the morphology of landscapes.
Administrative Borders and Redistricting
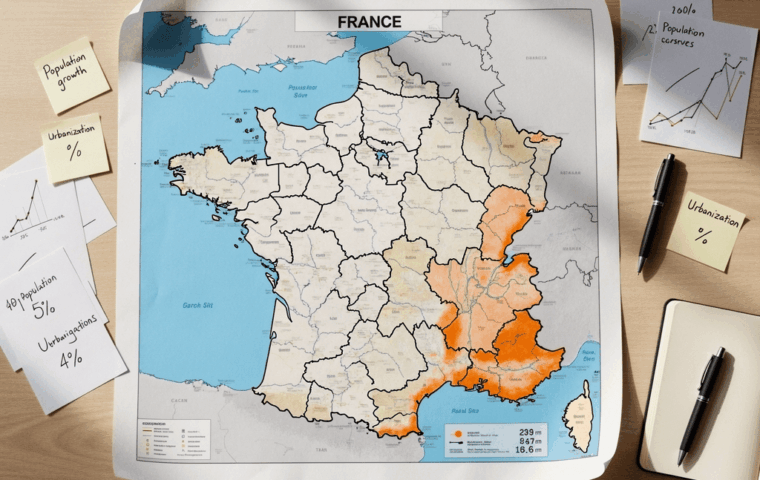
Over the course of emperors and Republics, the outlines of departments and regions have been redrawn. In 2016, the merger of certain regions (Alsace, Lorraine, Champagne-Ardenne) was not the result of a simple political choice but relied on precise cartographic analyses: population density, economic flows, living areas. The map revealed stronger functional continuities than previously believed, justifying a new territorial coherence.
“The map is never neutral,” reminds historian Jean-Claude Martin: it brings out hierarchies, highlights certain axes over others, and ultimately shapes the daily life of inhabitants.
In several cases, the inhabitants themselves contested the border drawn on the map, denouncing a division too administrative, disconnected from cultural realities. The Alsatian or Basque claims movements testify to this: one cannot separate a terroir from its history by drawing a line.
The Map and the Construction of Regional Identity
Regional atlases, often published in the 20th century, contribute to the storytelling of a territory. By combining texts, photographs, and careful cartography, these works spread a heritage vision. They highlight architectural heritage (castles, churches) and emphasize emblematic landscapes (Norman cliffs, Bordeaux vineyard slopes).
When browsing a thematic map on the industrialization of Nord-Pas-de-Calais, one understands how mines, factories, and canals reshaped the space, while combining a strong working-class memory. Conversely, the tourist map of Occitanie evokes pilgrimage sites, mountain ranges, and Occitan linguistic areas. Each outline invites one to feel the uniqueness of a space.
- Cultural and gastronomic heritage highlighted through dedicated cartographies.
- Linguistic maps revealing dialectal islands and their evolution over time.
- Representations of the local economy: agricultural zones, innovation hubs, logistics corridors.
For the curious, the page Carte de France offers a fine collection of maps of the hexagon selected and classified by cartographic theme.
The digital revolution and GIS
The arrival of Geographic Information Systems (GIS) has revolutionized cartographic practice. Gone are the days when several weeks were needed to draw a line with an ink pen: today, 3D modeling, the integration of open databases, and collaborative tools make the work almost instantaneous.
Professionals, but also citizens, can overlay layers: population density, transport networks, pollution indices, protected areas… For spatial planning, this granularity facilitates decision-making. Elected officials combine budget and environmental issues, while urban planners test several urban expansion scenarios.
Open data and the emergence of new cartographies
The free access to geographic data by the State and local authorities encourages citizen initiatives. Participatory platforms gather reports, field photos, and real-time observations. The map then becomes a collective project, oscillating between citizen science and technological innovation.
Towards new perspectives for territories
In the era of climate change, cartography plays a major role in anticipating its effects. Topographic projections, coupled with climate models, identify flood risk zones or areas likely to experience prolonged droughts. Precision agriculture relies on these maps to optimize water use and reduce soil erosion.
On a cultural level, the revitalization of regional languages and intangible heritage finds in the map a tremendous vector of dissemination. Mobile applications allow discovering a heritage trail in augmented reality, combining geolocation and historical reconstructions. The rethought map becomes a guide to experience, more than a simple navigation tool.
FAQ
What was the primary role of the map in the history of French regions?
Initially, the map was used to secure travel and organize taxation. By setting precise boundaries, it later structured administrative territories and influenced the distribution of resources.
How do old maps differ from modern maps?
Old maps were based on manual surveys and often included symbolic legends. Modern maps use digital technologies, satellites, and GIS, offering centimeter-level accuracy and dynamic updates.
How does cartography contribute to regional identity?
By highlighting cultural routes, heritage assets, and environmental particularities, the map shapes how inhabitants and visitors perceive a territory. It serves as a support for local storytelling.
What are the future challenges of cartography for France?
The major challenges concern adaptation to climate, biodiversity protection, and citizen participation. Dynamic and augmented reality maps will open new ways to explore and manage territories.
{
“@context”: “https://schema.org”,
“@type”: “WebPage”,
“about”: {
“@type”: “Thing”,
“name”: “Cartography and history of French regions”
},
“keywords”: [“cartography”, “French regions”, “history”, “geography”, “regional identity”]
}